


The cryptocurrency market has witnessed a significant shift in investor sentiment, with recent data revealing that 32,000 Bitcoin just hit exchanges at a loss in a single day. This extraordinary event marks a pivotal moment in the digital asset’s trading cycle, raising critical questions about whether we’re witnessing the beginning of a recovery or the end of a prolonged bear market. The phenomenon of short-term holder capitulation has emerged as one of the most closely watched indicators among institutional and retail investors alike, suggesting that market exhaustion may finally be reaching its conclusion.
When large quantities of Bitcoin losses accumulate within a 24-hour period, it signals that retail investors and short-term traders are exiting their positions at unfavorable prices. This behavior, known as capitulation, historically precedes significant market bounces and represents a critical turning point in cryptocurrency market cycles. Understanding the mechanics behind this event and its implications for Bitcoin price prediction is essential for anyone attempting to navigate the volatile world of digital assets.
The intersection of technical analysis, on-chain metrics, and market psychology provides a comprehensive framework for interpreting what these massive loss events mean for future price movements. Rather than viewing capitulation as a permanent disaster, sophisticated investors recognize it as a contrarian signal that the market bottom may be forming. This article delves deep into the significance of this 32,000 Bitcoin event, explores the mechanisms driving short-term holder behavior, and examines whether the current market conditions truly signal a buying opportunity or merely a temporary reprieve in a longer downturn.
Bitcoin Price Prediction and Market Cycles
What Drives Bitcoin Price Movements and Market Sentiment
Bitcoin price prediction remains one of the most challenging endeavors in financial markets, complicated by the asset’s relative youth and susceptibility to macroeconomic factors, regulatory developments, and shifts in investor sentiment. The price of Bitcoin moves through predictable cycles, yet each cycle contains unique characteristics shaped by evolving market conditions and participant behaviors. Understanding these cycles requires more than just reading candlestick charts—it demands a comprehension of the psychological factors that drive buying and selling pressure.
The cryptocurrency market operates on a four-year halving cycle, during which the reward for mining new Bitcoin is cut in half. This structural element creates a predictable boom-and-bust pattern that has shaped Bitcoin’s price history since its inception. However, overlaid atop this macro cycle are numerous micro-cycles driven by sentiment shifts, technical breakdowns, and the accumulation or distribution of coins by large holders. When examining Bitcoin market analysis. Investors must consider both timeframes simultaneously to gain a nuanced understanding of price direction.
Market cycles in the Bitcoin ecosystem typically consist of four distinct phases: accumulation, appreciation, distribution, and decline. During the accumulation phase, smart money quietly purchases Bitcoin at low prices while media interest remains minimal. As prices begin rising and media attention increases. The appreciation phase generates excitement and FOMO (fear of missing out) among retail investors. The distribution phase sees early investors and institutions carefully exiting their positions as prices reach euphoric levels. Finally, the decline phase features capitulation. Panic selling, and the emergence of forced liquidations as leverage-heavy positions are wiped out.
The Role of Short-Term Holders in Cryptocurrency Markets
Short-term holders represent a crucial segment of the Bitcoin trading ecosystem. Typically consisting of retail investors, day traders, and algorithms designed to capitalize on intra-day and weekly price movements. These market participants operate with shorter time horizons than long-term institutional investors or Bitcoin believers who hold for years. While long-term holders tend to accumulate during downturns and hold through volatility, short-term holders are more prone to panic selling, particularly when facing losses.
The distinction between short-term holders and long-term holders becomes increasingly important when analyzing on-chain data. Long-term holder Bitcoin often sits in dormant wallets for extended periods. While short-term holder coins move between exchanges with greater frequency. By tracking the movement of these coins. Analysts can gauge whether the market is entering a phase of capitulation or accumulation. When short-term holders begin aggressively selling, prices typically bottom as the last weak hands exit the market, leaving only committed investors behind.
Short-term holder capitulation manifests as increased selling volume during price declines, with particular intensity when prices fall below recent support levels or break multi-month technical formations. This selling often accelerates in self-reinforcing feedback loops. Where price declines trigger stop-loss orders and margin calls. Forcing additional selling that pushes prices lower still. However, capitulation events often represent the final washout before market recovery. As selling pressure exhausts itself and remaining holders possess stronger conviction.
The 32,000 Bitcoin Event: What Happened and Why It Matters
Analyzing the Single-Day Loss Event
The event wherein 32,000 Bitcoin just hit exchanges at a loss in a single day represents one of the most significant single-day capitulation events in recent cryptocurrency history. This metric, tracked through on-chain analysis platforms, measures the number of Bitcoin that moved onto exchange wallets with a negative realized price—meaning the coins were purchased at a higher price than their current value. The sheer volume of this event stunned market participants and dominated trading discussions across all major cryptocurrency forums.
To contextualize this event, it’s important to understand that Bitcoin exchange flows typically increase during market downturns as holders attempt to liquidate positions. However, the specific tracking of coins moved at a loss provides crucial insight into whether selling is driven by panic or strategic rebalancing. When 32,000 Bitcoin—worth approximately $960 million to $1.28 billion depending on price levels—suddenly appears on exchanges at realized losses, it indicates that thousands of investors have reached their capitulation point and are willing to accept losses rather than endure further price declines or margin calls.
This capitulation event didn’t occur in isolation. Rather, it was preceded by weeks of declining prices, growing pessimism across social media channels, and an increasing number of investors asking whether Bitcoin could potentially reach zero or drop to much lower levels. The psychological breaking point had been reached for many short-term holders who had entered the market at higher prices and watched their portfolios decline by 30%, 40%, or even 50% or more. When faced with the choice between holding through continued uncertainty or accepting losses, many chose the latter.
Realized Price and Loss Metrics
Realized price represents the average price at which Bitcoin currently being moved was originally purchased. When Bitcoin trades below this realized price. The coins are considered to be trading at a loss. By aggregating this data across all Bitcoin movement. Analysts can determine how many coins are being moved at a loss on any given day. This metric proves far more valuable than simple price action for understanding market psychology. As it reveals whether current selling pressure comes from underwater positions or strategic profit-taking.
The Bitcoin realized loss event on the day in question indicated that most Bitcoin being moved onto exchanges came from investors who had purchased at higher prices. This contrasts with realized profits, where investors move coins to exchanges at prices higher than their purchase price. Typically indicating profit-taking by winners. A day dominated by realized losses signals capitulation by holders who believed the pain of holding exceeded the hope of recovery. Such events often mark bottoms because they indicate that weak hands have finally exited.
Historical analysis reveals that significant realized loss events typically precede strong price recoveries within days or weeks. The mechanism behind this pattern is straightforward: once all investors willing to sell at losses have exited the market. The remaining holder base consists primarily of believers and those committed to long-term accumulation. Without weak hands continually selling. Bitcoin price recovery becomes possible as even modest buying pressure from new entrants can push prices higher. The removal of capitulation-driven selling pressure represents a structural shift in supply-demand dynamics.
Is This Capitulation Signaling the Bottom?

Historical Precedent and Previous Capitulation Events
Bitcoin and the broader cryptocurrency market have experienced several previous capitulation events that offer valuable historical context for evaluating the current situation. The crypto crash of December 2018 featured similar capitulation characteristics, with massive volumes of Bitcoin being moved onto exchanges at losses. That event marked the local bottom of the 2017-2018 bear market. After which prices remained depressed for several more months before eventually recovering. The 2020 Black Swan event in March similarly featured panic selling and capitulation, followed by one of the strongest recoveries in Bitcoin’s history.
Each previous capitulation event shared common characteristics: overwhelming selling pressure, media narratives suggesting Bitcoin was finished. Significant liquidations of leveraged positions, and capitulation prices that often proved sustainable as support levels. Following these events. Bitcoin typically rebounded quickly over days to weeks as forced selling exhausted itself and the remaining holder base proved more committed. The presence of these historical precedents suggests that current Bitcoin capitulation signals warrant serious consideration by investors evaluating timing for entry or increased positions.
However, it’s crucial to recognize that past performance provides no guarantee of future results. Market conditions evolve. Participants change, and macroeconomic environments shift. The capitulation occurring today happens against a different backdrop than previous events—one potentially including higher interest rates. Reduced cryptocurrency sentiment among institutions. Or increased regulatory scrutiny. While historical patterns offer guidance. They cannot provide certainty about future price movements or the timing of recovery.
Technical Analysis and Chart Patterns
From a technical analysis perspective, capitulation events often occur near key support levels or after breaking below multi-year chart formations. The current Bitcoin price action, combined with the 32,000 Bitcoin loss event, suggests that prices may have reached a significant technical inflection point. When combined with other technical indicators—such as the Relative Strength Index (RSI) reaching oversold territory. Moving averages providing support, and key Fibonacci retracement levels aligning with price action—the case for a potential bottom grows stronger.
Technical support levels become increasingly important during and after capitulation events. If prices bounce from key support levels following massive loss events. This creates a bullish case for further recovery. Conversely, if prices break below these key levels after capitulation, it suggests that selling pressure remains overwhelming and additional capitulation may be forthcoming. Traders and investors monitoring these levels closely can identify whether the current bottom represents a true inflection point or merely a temporary pause in a longer downtrend.
Chart patterns also provide important signals. Many technical analysts point to the formation of double bottoms or V-shaped reversal patterns following capitulation events. These patterns suggest that price has found a floor and is beginning to recover. However, some analysts caution that capitulation can sometimes lead to further downside if macroeconomic conditions worsen or if major negative news catalysts emerge.
On-Chain Metrics and Their Implications
On-chain analysis provides crucial data unavailable in traditional markets. Allowing investors to track Bitcoin network activity, wallet movements, and holder behaviors directly. Several on-chain metrics have improved following the 32,000 Bitcoin capitulation event, suggesting that the worst may have passed. The number of wallets holding Bitcoin has stabilized or increased, indicating that investors are accumulating despite lower prices rather than continuing to exit positions.
The Bitcoin supply on exchanges has also begun declining. A positive signal suggesting that investors are removing Bitcoin from exchanges for long-term storage rather than continuing to sell. This behavior, known as hodling or holding long-term, creates a supply-demand imbalance that favors higher prices. When exchange supply declines while prices are rising. It reinforces the bull case. As it indicates that accumulation is occurring at attractive prices.
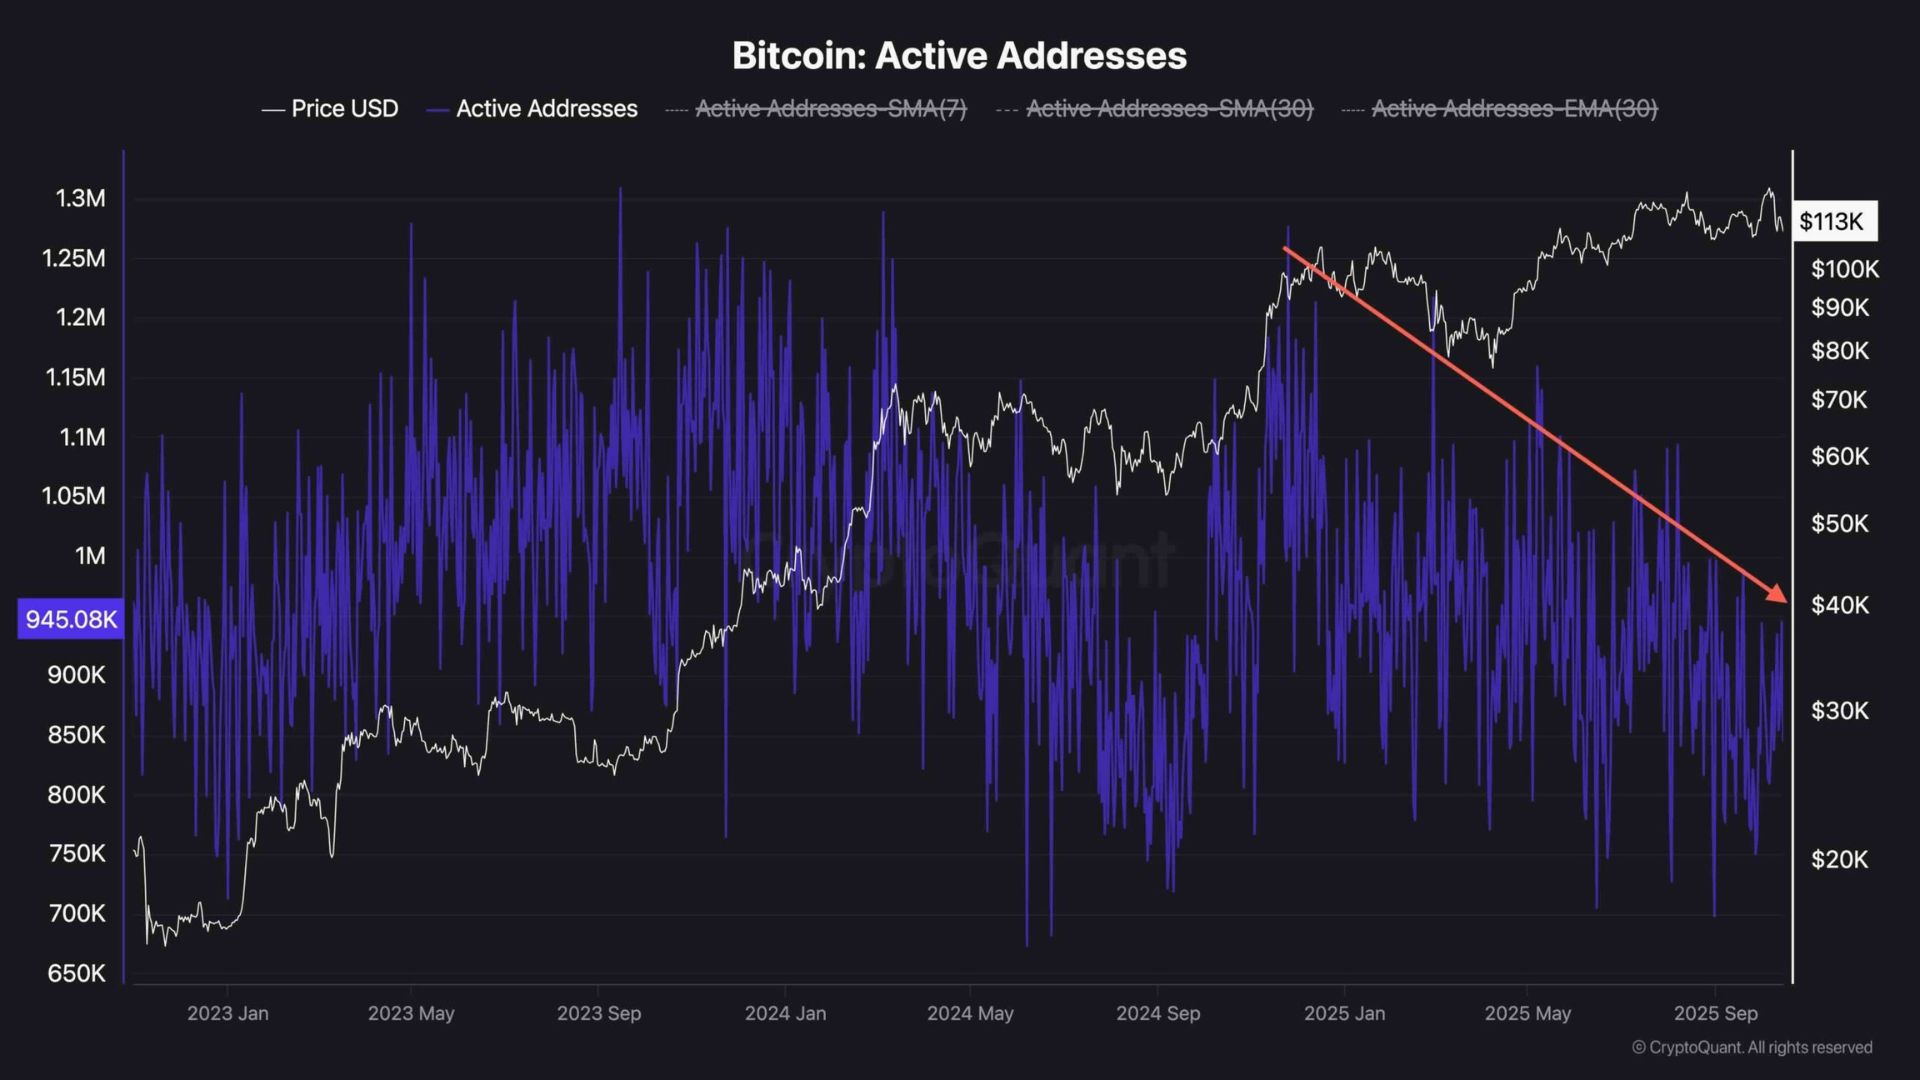
Active address metrics and transaction data also provide insight into market health. Following major capitulation events. These metrics often show a period of stagnation as markets digest losses, followed by renewed growth as confidence returns. If these metrics begin improving in coming weeks and months. It would suggest that the capitulation truly marked a bottom and recovery is underway. Conversely, if metrics continue deteriorating, it may indicate that additional selling pressure remains.
Market Implications and Investor Considerations
What This Means for Bitcoin Price Prediction Going Forward
The 32,000 Bitcoin capitulation event provides important data for improving Bitcoin price prediction accuracy, though it doesn’t provide certainty about near-term or long-term price direction. Investors should view this event as evidence that a potential bottom may be forming, but not as a guarantee of immediate recovery or sustained rallies. Rather, it represents a shift in market psychology from panic to relative stability. Potentially setting the stage for recovery depending on macroeconomic and regulatory developments.
Bitcoin price targets following capitulation events are often established based on technical support levels. Psychological round numbers, and previous price history. Some analysts project recovery toward recent resistance levels, while others suggest more modest bounces before additional selling pressure emerges. The time horizon for recovery remains uncertain—some previous capitulation events led to recovery within days. While others required months of consolidation before sustained rallies began.
Macroeconomic factors will likely prove decisive in determining whether this capitulation truly marks a bottom. If interest rates stabilize or decline. If inflation pressures ease, and if broader risk sentiment improves, Bitcoin stands a much better chance of sustained recovery. Conversely, if economic conditions deteriorate further, recession looms, or regulatory action intensifies. The current capitulation may represent only a temporary pause before additional declines. Investors must remain alert to these external factors while monitoring on-chain and technical indicators for early warning signals.
Risk Management and Position Sizing
For investors considering adding to Bitcoin positions following capitulation, proper risk management remains essential. Even when capitulation signals suggest a potential bottom, market conditions can change rapidly. Sizing positions appropriately and maintaining strict stop-loss discipline ensures that portfolios remain protected while still allowing for upside participation if recovery occurs.
Dollar-cost averaging represents a prudent strategy during periods of market uncertainty. Rather than deploying all available capital at once. Averaging in over weeks or months reduces timing risk and allows investors to benefit from further downside if prices continue declining. This approach acknowledges that capitulation events don’t guarantee immediate recovery while still positioning portfolios for potential gains as recovery unfolds.
Conclusion
The event wherein 32,000 Bitcoin just hit exchanges at a loss in a single day represents a significant capitulation signal that warrants serious attention from investors monitoring Bitcoin price prediction and market cycles. Historical precedent suggests that such massive loss events often precede market recovery. As they indicate that weak hands have finally exited and selling pressure is exhausting itself. The combination of this capitulation event with improving on-chain metrics and supportive technical indicators creates a potential case for considering this a bottom-formation point.
However, capitulation alone doesn’t guarantee recovery. Macroeconomic factors. Regulatory developments, and broader market sentiment will ultimately determine whether the current bottom proves durable or merely temporary. Investors should view this period as an opportunity to reassess their risk tolerance. Rebalance portfolios, and potentially accumulate assets at attractive prices—all while maintaining appropriate risk management discipline.
The short-term holder capitulation evident in recent market data removes one source of selling pressure that had previously been pushing prices lower. With weak hands exiting the market, price discovery may finally shift to reflect the rational valuations of long-term believers rather than panic-driven selling by temporary holders. As we move forward, monitoring both on-chain data and technical indicators will prove essential for understanding whether this capitulation truly marked the bottom or merely a temporary respite in a longer-term downturn.
FAQs
Q. What exactly does “Bitcoin short-term holder capitulation” mean, and how does it differ from regular selling?
Short-term holder capitulation refers to a specific pattern where investors who purchased Bitcoin relatively recently—typically within days to months—suddenly sell their positions at significant losses. This differs from regular selling because it indicates panic or forced liquidations rather than strategic profit-taking or portfolio rebalancing. When the majority of selling comes from investors willing to accept losses, it often signals that emotional exhaustion has reached an extreme, typically preceding price recovery. Regular selling, by contrast, may occur across all investor types and doesn’t necessarily indicate an imminent bottom.
Q. How reliable is the “32,000 Bitcoin loss event” as a bottom-formation signal?
While the 32,000 Bitcoin loss event provides valuable data suggesting a potential bottom may be forming, it’s not infallible. Historical analysis shows that major capitulation events often do precede recoveries. Sometimes by days or weeks. However, the timing and extent of recovery vary considerably. Additionally, capitulation doesn’t guarantee upward movement—if macroeconomic conditions worsen significantly or major negative news emerges. Prices could continue declining despite strong capitulation signals. This metric should be combined with technical analysis, on-chain indicators, and macroeconomic assessment rather than relied upon in isolation.
Q. What time horizon should investors consider when evaluating Bitcoin price recovery after capitulation?
Bitcoin price recovery following capitulation events varies considerably based on market conditions. Some historical capitulation events have been followed by sharp bounces within days, creating quick trading opportunities. However, true sustainable recovery typically requires weeks or months. As prices need to rebuild investor confidence and overcome resistance levels. Investors should distinguish between short-term bounces and longer-term trend reversals when developing their strategies. Patient investors willing to hold through consolidation phases often benefit most from capitulation events, while short-term traders must be nimble to capture quick bounces.
Q. Should I invest in Bitcoin immediately after a capitulation event, or should I wait for additional confirmation?
This depends on your investment timeline, risk tolerance, and capital availability. Investors with long-term horizons may find capitulation events attractive times to accumulate. As they’re acquiring assets at depressed prices when sentiment is negative. However, waiting for additional confirmation in the form of technical bounces, improving on-chain metrics. Or stabilizing prices can reduce the risk of catching further downside. Dollar-cost averaging, where you invest fixed amounts over time. Balances the desire to capture bottoms with the reality that timing the precise low is nearly impossible. Always size positions appropriately for your risk tolerance.
Q. What macroeconomic factors should I monitor to validate whether this capitulation truly marks the bottom?
Several macroeconomic factors will prove decisive in confirming whether the current capitulation represents a true bottom. Interest rate trends are crucial. As declining or stabilizing rates typically support risk asset recovery. Inflation data matters significantly. As Bitcoin’s value proposition improves when inflation fears are elevated. Banking stability and credit market stress should be monitored. As financial system stress historically pressures Bitcoin. Finally, regulatory developments affecting cryptocurrency require ongoing attention. As surprise negative news could trigger additional selling. Investors should maintain awareness of these factors while monitoring on-chain and technical indicators for confirming or contradicting signals.
